

Anyone here with AMB Dividend Trust got their distribution units from dividends reflected in their holdings yet?
This post has been edited by yenforyen: May 30 2013, 02:11 PM
Fundsupermart.com v3, Manage your own unit trust portfolio
Fundsupermart.com v3, Manage your own unit trust portfolio
|
|
 May 30 2013, 02:11 PM May 30 2013, 02:11 PM
Return to original view | Post
#1
|
 
Junior Member
84 posts Joined: Feb 2011 From: Kuala Lumpur |
Anyone here with AMB Dividend Trust got their distribution units from dividends reflected in their holdings yet?
This post has been edited by yenforyen: May 30 2013, 02:11 PM |
|
|
|
|
|
Jun 5 2013, 09:30 AM
Return to original view | Post
#2
|
|
Junior Member
84 posts Joined: Feb 2011 From: Kuala Lumpur |
QUOTE(nothingz @ Jun 5 2013, 07:25 AM) means it will continue to rally right since most likely they wont stop QE due to weak reports Plotted the 1-month treasury yield curve and the yield has been increasing since mid-may.  Bond yield increases when there is a decrease in bond-buying (demand). From Feb 13 to May 13, the yield has been on a gradual decline from a maximum of 0.12% to a minimum of 0% in mid-may. The average YTD 1-mo yield is 0.05%. As of Jun 4, the yield was 0.05%. This could be a possible indication of the Fed tapering its bond-buying program of $85 bil/month. (see jpeg attached) 
Data source: U.S Department of Treasury |
|
|
Jun 5 2013, 10:23 AM
Return to original view | Post
#3
|
|
Junior Member
84 posts Joined: Feb 2011 From: Kuala Lumpur |
Pink Spider, does a fund's NAV usually fluctuate within the 1-yr high and 1-yr low range?
Funds like Hwang Select Income doesn't seem to break out of the 1-yr high and 3-yr high of 0.68. Even if it did, it was only marginally to 0.6829. Thereafter, it's a downhill movement to fall back to preceding levels of the 0.68.  This post has been edited by yenforyen: Jun 5 2013, 10:25 AM |
|
|
Jun 5 2013, 10:32 AM
Return to original view | Post
#4
|
|
Junior Member
84 posts Joined: Feb 2011 From: Kuala Lumpur |
QUOTE(Pink Spider @ Jun 5 2013, 10:27 AM) Boss, Hwang Select Income Fund makes distributions usually twice a year which will bring NAV price down. Well yes, even if distributions come into play, I still don't quite get the concept behind the range-bound NAV. -__-Don't look at NAV price lar, it does not mean much. Hwang Select Income Fund lower risk than KidSave  This post has been edited by yenforyen: Jun 5 2013, 10:33 AM |
|
|
Jun 5 2013, 10:37 AM
Return to original view | Post
#5
|
|
Junior Member
84 posts Joined: Feb 2011 From: Kuala Lumpur |
QUOTE(Pink Spider @ Jun 5 2013, 10:33 AM) Go read Post #1 THOROUGHLY Yeah, read through post 1 before. Am also aware of the NAV-drop post distribution. |
|
|
Jun 5 2013, 10:42 AM
Return to original view | Post
#6
|
|
Junior Member
84 posts Joined: Feb 2011 From: Kuala Lumpur |
QUOTE(Pink Spider @ Jun 5 2013, 10:41 AM) I got a durian tree This is quite a good analogy. Thank you!On the tree got 10 durians Tomorrow 2 biji dropped and I took and sold Later grow another 2 biji Then 2 biji dropped and I took and sold *repeat and repeat and repeat* |
|
|
|
|
|
Jun 5 2013, 10:45 AM
Return to original view | Post
#7
|
|
Junior Member
84 posts Joined: Feb 2011 From: Kuala Lumpur |
QUOTE(Kaka23 @ Jun 5 2013, 10:40 AM) Should not worry about how high the NAV or low the NAV fluctuating. Should have an idea on the region of where the fund is investing and do you think you have confident on the region growth. Your believe on this region need to be back up on how confident of you on US, Europe and China. As those big country kena flu, it will drag down other regions. Thanks! Yes, fair enough. It goes back to the fundamentals, future earnings growth, and also not to look too much into the NAV per se but the total value (units x NAV) of one's holdings.If you dont know how the specific region will fair, you will need to believe on the fundamentals and datas from analysis and economist. |
|
|
Jun 5 2013, 10:46 AM
Return to original view | Post
#8
|
|
Junior Member
84 posts Joined: Feb 2011 From: Kuala Lumpur |
QUOTE(Pink Spider @ Jun 5 2013, 10:43 AM) if u still dun understand I gonna pluck your armpit hair and let it grow and pluck and grow and pluck now that's crude! haha |
|
|
Jun 5 2013, 10:51 AM
Return to original view | Post
#9
|
|
Junior Member
84 posts Joined: Feb 2011 From: Kuala Lumpur |
QUOTE(Pink Spider @ Jun 5 2013, 10:50 AM) Now I'm doubling as HwangIM ambassador Chill la bro, the more you share the more pahala.  http://hwangim.com/investment-solutions/re...ect-income-fund See fact sheet. FSM maybe needs time to update the figures cos it's a new fund to FSM platform  |
|
|
Jun 5 2013, 10:53 AM
Return to original view | Post
#10
|
|
Junior Member
84 posts Joined: Feb 2011 From: Kuala Lumpur |
QUOTE(TakoC @ Jun 5 2013, 10:53 AM) Tarak lar. Usually is under Other Performance Data column one. Scroll down further till you see bid-to-bid annualized returns. It's there. In a table format |
|
|
Jun 5 2013, 02:38 PM
Return to original view | Post
#11
|
|
Junior Member
84 posts Joined: Feb 2011 From: Kuala Lumpur |
QUOTE(s_kates81 @ Jun 5 2013, 01:11 PM) I never really understood the conecept of annualised return. Can you explain as per below? Suppose Fund A makes 10 % in 2012 makes -2 % in 2011 makes 13 % in 2010 5 % in 2009 How to annualise above? 
|
|
|
Jun 5 2013, 04:31 PM
Return to original view | Post
#12
|
|
Junior Member
84 posts Joined: Feb 2011 From: Kuala Lumpur |
QUOTE(Pink Spider @ Jun 5 2013, 04:29 PM) Done. Whoa now my chart is immortalized on the first post itself lolThat coconut thingy...don't need lar, repeating it for laughs once in a while ok what? |
|
|
Jun 5 2013, 04:34 PM
Return to original view | Post
#13
|
|
Junior Member
84 posts Joined: Feb 2011 From: Kuala Lumpur |
QUOTE(Pink Spider @ Jun 5 2013, 04:33 PM) remember don't delete the attachment no prob! |
|
|
|
|
|
Jun 12 2013, 08:49 AM
Return to original view | Post
#14
|
|
Junior Member
84 posts Joined: Feb 2011 From: Kuala Lumpur |
QUOTE(GottliebDaimler @ Jun 11 2013, 05:14 PM) Is it ever too late to join the bandwagon on Kenanga Growth Fund? Why is this fund rock solid going up? You could always start by perusing their annual report, the underlying funds are usually outlined towards the end of the report. From there you can sorta gauge if the individual stock component is trading at an overvaluation or vice versa. When looking at P/E as a gauge, one has to compare it with its peers in the same industry/sector. Take into account also if the company has solid fundamentals moving forward, such as future earnings growth. |
|
|
Jun 12 2013, 12:20 PM
Return to original view | Post
#15
|
|
Junior Member
84 posts Joined: Feb 2011 From: Kuala Lumpur |
QUOTE(Pink Spider @ Jun 12 2013, 09:21 AM) But by the time the annual report is out, it's (the holdings listing) usually wayyyyyyy outdated. Like Pacific GSF's "latest" report, it's dated 31 March but only published yesterday Yeah, but at least after you know the underlying stocks, then can track it against the current valuations.  This post has been edited by yenforyen: Jun 12 2013, 12:21 PM |
|
|
Jul 5 2013, 05:30 PM
Return to original view | Post
#16
|
|
Junior Member
84 posts Joined: Feb 2011 From: Kuala Lumpur |
QUOTE(gark @ Jul 5 2013, 12:56 PM) Here is the latest CAPE for global equity investment. Great info gark! May I know the source to the data?CAPE = Cyclically adjusted PE CAPE is typically more accurate representation of equity value as it has been adjusted for 10 years average & inflation adjusted. [attachmentid=3520973] Latin America & China/HK looks good, which is where i am investing aggressively now. Europe is also fair - maybe should invest there now... US & ASEAN looks way overpriced...  |
|
|
Jul 11 2013, 11:27 AM
Return to original view | Post
#17
|
|
Junior Member
84 posts Joined: Feb 2011 From: Kuala Lumpur |
QUOTE(Pink Spider @ Jul 10 2013, 11:22 AM) My wild guess would be EPF need not verify your akaun balances via system, they just see your statement. One word, LAZY GLC workers I think it is more of an act to deter investors from using their EPF to invest in funds. Since the attachment of EPF statements can be somewhat tedious and cumbersome, it indirectly discourages a lot of people from using the EPF to invest. (Some may beg to differ) After all, the second highest withdrawal in value happens to be the EPF members investing scheme after the primary withdrawal at 55 years of age. 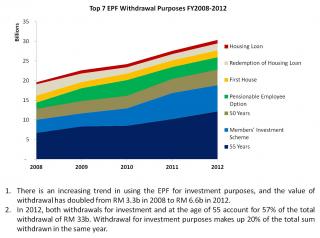
|
|
|
Jul 11 2013, 11:39 AM
Return to original view | Post
#18
|
|
Junior Member
84 posts Joined: Feb 2011 From: Kuala Lumpur |
QUOTE(Pink Spider @ Jul 11 2013, 11:37 AM) For ppl with I-Akaun, just have to go online to print, simple But there are still a lot of people who don't use the e-statement service |
|
Topic ClosedOptions
|
| Change to: |  0.0417sec 0.0417sec
 0.11 0.11
 7 queries 7 queries
 GZIP Disabled GZIP Disabled
Time is now: 6th December 2025 - 11:04 AM |
 Quote
Quote