

guys, what is bid-to-bid annualised/cumulative return? and how are they calculated?
i tried googling for a while and yet not much info on how these numbers being produced.
Fund Investment Corner v3, Funds101
Fund Investment Corner v3, Funds101
|
|
 Jun 17 2019, 04:23 PM Jun 17 2019, 04:23 PM
Return to original view | Post
#1
|

Junior Member
142 posts Joined: Feb 2018 |
guys, what is bid-to-bid annualised/cumulative return? and how are they calculated?
i tried googling for a while and yet not much info on how these numbers being produced. |
|
|
|
|
|
Jun 18 2019, 11:49 AM
Return to original view | Post
#2
|
|
Junior Member
142 posts Joined: Feb 2018 |
QUOTE(yklooi @ Jun 17 2019, 09:16 PM) I made the assumption.... appreciate alot on the image of the calculation that you are referring to unit trust fund that you know about the definition of annualised and cumulative..... as this example is for a year "Period", thus need to convert to cumulative and annualised    actually i try to figure how the numbers of the chart below being generated. 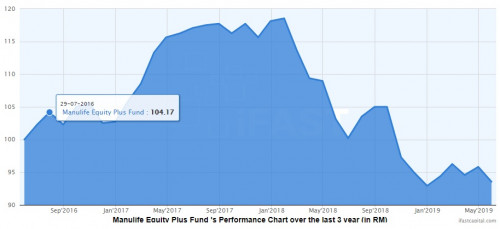 normally the footnote will put "Performance figures are absolute returns based on the price of the fund as at June 14, 2019 (Last updated on June 18, 2019),on NAV-to-NAV basis,with dividends being 'reinvested' on the dividend date." this is why i ask about bid to bid returns. |
|
|
Jun 18 2019, 11:50 AM
Return to original view | Post
#3
|
|
Junior Member
142 posts Joined: Feb 2018 |
double post~
This post has been edited by turtleundersea: Jun 18 2019, 11:50 AM |
|
|
Jun 18 2019, 12:28 PM
Return to original view | Post
#4
|
|
Junior Member
142 posts Joined: Feb 2018 |
QUOTE(yklooi @ Jun 18 2019, 11:52 AM) oh, that, is I think is the movement of the fund performance (dividend distribution adjusted), the term "dividend distribution adjusted", how does it apply to calculation of NAV/performance?using the 100 marks as a base point for start date & NAV 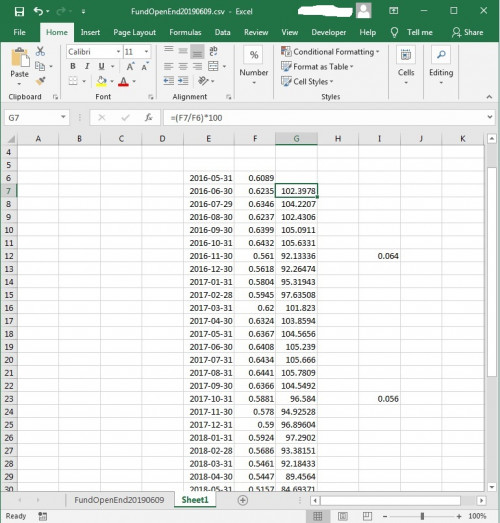 the chart on previous post is mandatory 3 years performance from ifast. and i have compile the NAV on each date (last working day of every month) and the calculation of each date shown in the current image. but i cannot get the exact numbers as in the chart. for example: 2016-06-30 >> 102.29(chart) >> 102.39 (my calculation) 2016-07-29 >> 104.17(chart) >> 104.22 (my calculation) i was thinking i didnt include the income distribution, but if so, how does the calculation gonna be if include income distribution? This post has been edited by turtleundersea: Jun 18 2019, 12:32 PM |
| Change to: |  0.0192sec 0.0192sec
 0.77 0.77
 7 queries 7 queries
 GZIP Disabled GZIP Disabled
Time is now: 14th December 2025 - 01:12 PM |
 Quote
Quote