its up to the americans who they wanna elect, I'll jus adjust my strategies according to their new policies
 http://www.washingtontimes.com/blog/inside...-out-obama-win/
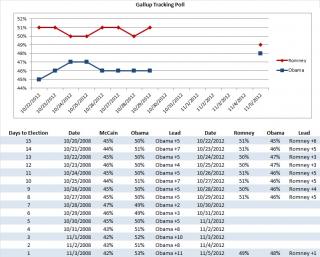
Paddy Power, which takes bets on politics, said Sunday it has called the race for Mr. Obama and already has paid out to those who bet on the president to win re-election. Known for its flamboyant early payouts, Paddy Power said it has put its neck on the line for 650,000 Euros, which at current exchange rates is more than $830,000
jim is alwiz right
 http://www.businessinsider.com/jim-cramer-...ndslide-2012-11
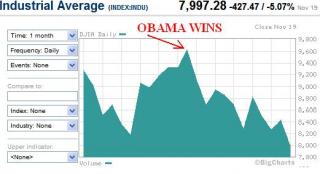
Jim Cramer: Obama Is Going To Obliterate Romney In A Historic Landslide
those momo with the moolah, imagine once this are released and its money multiplier effect
 http://www.cnbc.com/id/49519419/Companies_...han_Ever_Before
Amid a lackluster earning season that has featured many companies missing sales expectations, cash balances have swelled 14 percent and are on track toward $1.5 trillion for the Standard & Poor's 500, according to JPMorgan. Both levels would be historic highs
For three years, Wall Street’s been telling the world how much it can’t stand President Barack Obama
http://www.politico.com/news/stories/0612/77368.htmlIt is critical that the next president appreciates that America’s prosperity is driven by the innovation and hard work of the American worker, whose valiant efforts have, in recent years, been undermined by the oppressive weight of government intervention
why aren't they confident? they can't go on blaming bush for everything? do u see najib blaming badawi?
 http://finance.yahoo.com/news/us-employers...2--finance.html
The economy seems so gripped by uncertainties that many employers have decided to manage with the staff they have. They aren't convinced their customer demand will keep growing. Or they worry that Europe's festering debt crisis could infect the global economy. Or they aren't sure what Congress will do, if anything, about taxes and spending in coming months

No matter what your political affiliation, the significant growth in food stamp rolls versus little new job creation since January 2009 is an unsettling data point in the weak U.S. economic recovery
http://www.forexpros.com/analysis/job-crea...mp-rolls-142198As noted in a recent Weekly Standard article:
"In January 2009, there were 133.56 million Americans with jobs and 31.98 million on food stamps. Today, there are 133.76 million Americans with jobs and 46.68 million on food stamps. The employment rolls have thus grown by 0.15 percent and the food stamp rolls have grown by 46 percent, meaning that for every one American who found a job, 75 Americans signed up for food stamps.
Total spending on food stamps is now more than $80 billion annually, a fourfold increase from 2001. Total spending on federal means-tested welfare—food stamps, public housing, social services, cash aid, etc.—is now approximately $1 trillion. That amount is enough, if converted to cash, to send every household beneath the federal poverty line an annual check for $60,000."
As noted in an article I published earlier this week, U.S. Federal Budget At Critical Juncture, the growth in entitlements is on an unsustainable path. Stronger economic growth and more fiscal discipline in Washington is necessary to reverse the U.S. deficit growth.
can u imagine if najib does this to bolehland and wat would be the effect? deserves a kick in the arse
http://finance.yahoo.com/news/economy-fact...-222800832.htmlThe harder they fall, the bigger they bounce.
That's the general rule of recessions. But the current expansion hasn't followed this path, in large part because of political uncertainties in terms of taxes and regulations. Add Europe's debt problems and China's slowdown, and you're left with a sluggish U.S. economy at a time when it should be soaring.
The recovery is more than three years old, but by a wide variety of key economic indicators, activity is either below old highs, growing at an anemic pace or not returning to long-term trend lines. The accompanying six charts show key gauges of economic activity that spell out how far we remain from a real recovery. Here's what the charts say.
1. Economic Growth Gross domestic product peaked at the end of 2007 and it took America four years to surpass that level.
Typically GDP growth is strong after a recession — especially after a sharp downturn. The economy returns to a long-term trend line.
But this expansion — despite massive deficit-fueled government spending and Federal Reserve money printing — has been the weakest in decades. Not only has the U.S. economy not returned to the old growth path, it's falling further behind.
Growth so far in 2012 has averaged less than 2%, too low to produce enough new jobs to keep up with population and productivity gains.
2. Leading Economic Indicators The Index of Leading Economic Indicators includes a variety of forward-looking economic data. And this chart reflects the true nature of the recession and tepid recovery even better than GDP does.
The LEI peaked in April 2000 — just after the stock market top but nearly a year before the recession.
After the 2001 recession, the LEI initially was sluggish. It took off in late 2003 about the time that the second round of Bush tax cuts kicked in. By early 2004 the index had hit a new high. Then it continued to power ahead.
The LEI stalled out in early 2007 — again, several months before a new recession. The index rebounded from the sharp fall, but has stalled in recent months. That suggests U.S. economic growth will slow further.
In technical analysis terms, the index has made a lower low and has yet to make a higher high. And that pretty much sums up the economy — and why it feels so weak and vulnerable on the macro level and on Main Street.
3. Employment Nonfarm payrolls have been rising since February 2010, but they remain 4.52 million below their January 2008 peak. At 56 months through September, this already is the longest jobs recession since the Great Depression.
There's a very real chance that the U.S. will fall back into recession before employment hits a new high. And America needs several million jobs above and beyond the old level to absorb increases in the working-age population.
The unemployment rate has fallen back to a still-high 7.8%, but only because the labor force participation rate has fallen to long-term lows. Joblessness would be 11% or higher if millions of Americans hadn't given up looking for work.
4. Consumer Spending Consumers have done OK in the last few years, but that's relative. Tax cuts and the end of job losses helped real consumer spending rebound at a 2.5%-3% rate in late 2010 to late '11. That was close to the pace set during the prior expansion.
But with job and wage growth still anemic, spending has cooled to 2%. Much like overall economic activity, consumers have not returned to the old trend line and continue to lag. Note that consumers never retreated during the shallow 2001 recession.
5. Business Investment This is one of the biggest worries, because investment drives future economic growth.
But corporations have been remarkably reluctant to invest during the current expansion, despite record profits and cash holdings. Blame weak U.S. and global economic growth and a big expansion of government — including sweeping and yet-to-be written regulations from the EPA, ObamaCare and the Dodd-Frank financial reform.
In recent months, core capital goods orders — a proxy for future business investment — have fallen sharply as firms fear the looming "fiscal cliff" of major tax hikes and spending curbs set to start Jan. 1.
Business investment was weak in the prior expansion, not eclipsing the old high until 2008, when the recession had already started. So corporate spending is nowhere near the 1990s trendline, which admittedly may have been inflated by Y2K and the dot-com bubble.
The lack of business investment in new technology and other capital goods bodes ill for the U.S. economy. Right now, it means a key source of growth and jobs is on the sidelines. In the long term, investment is crucial to boosting productivity, ultimately the best guide to economic growth and wage gains.
6. New-Home Sales Housing is on the mend, but a quick glance at the new-home sales chart shows that the sector is just getting out of the basement.
Housing will not — and should not — reach the bubble-era peaks for a long, long time. But new-home sales are still far below 1990s levels. That means depressed construction employment and fewer purchases of furniture, appliances and other big-ticket housing goods.
This post has been edited by learn2earn8: Nov 5 2012, 03:38 PM 

 May 7 2012, 10:57 AM


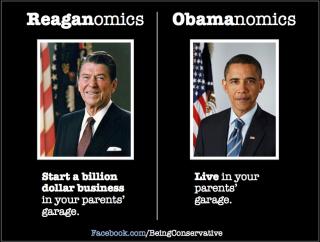
 be lazy & expect lots of welfare handouts
 below 200% gonna be a bumpy ride for the month of may
 http://finance.yahoo.com/news/herbalife-dr...-155727610.html
 Quote
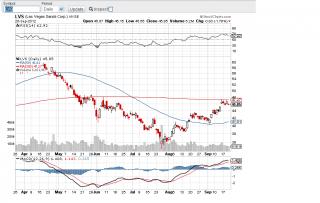
Quote many years ago, all talk nothing but lvs
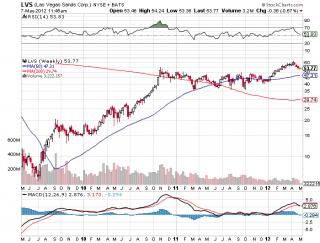
 they prefer argument rather than kok-peration
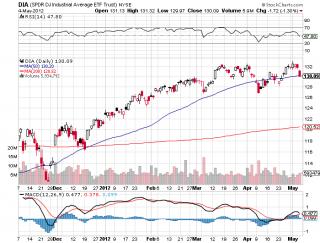
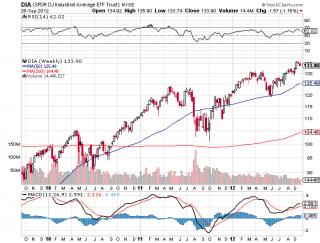
 dog jones still neither here nor there


 but gambling this 2 to go up tonight


 oh well, shit do happen and can't win them all
 0.0674sec
 0.69
0.69
 7 queries
 GZIP Disabled