

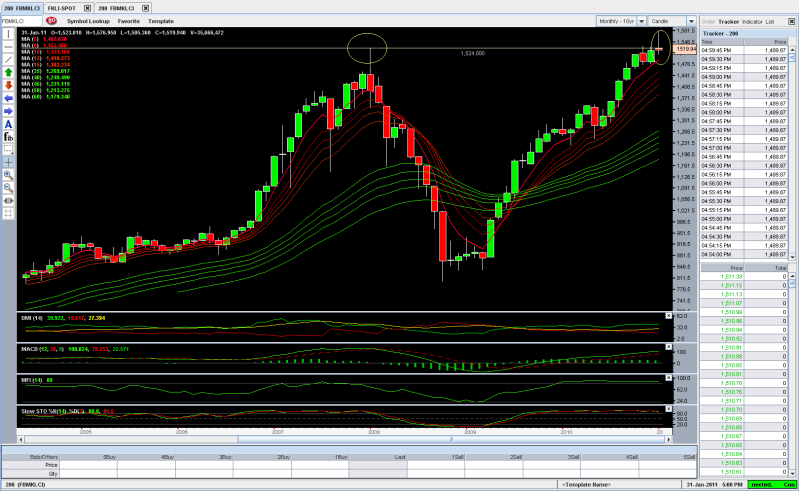
no doubt double top is hit...will CI get pass it or market force will kick it down?
quite a clear divergence in the weekly
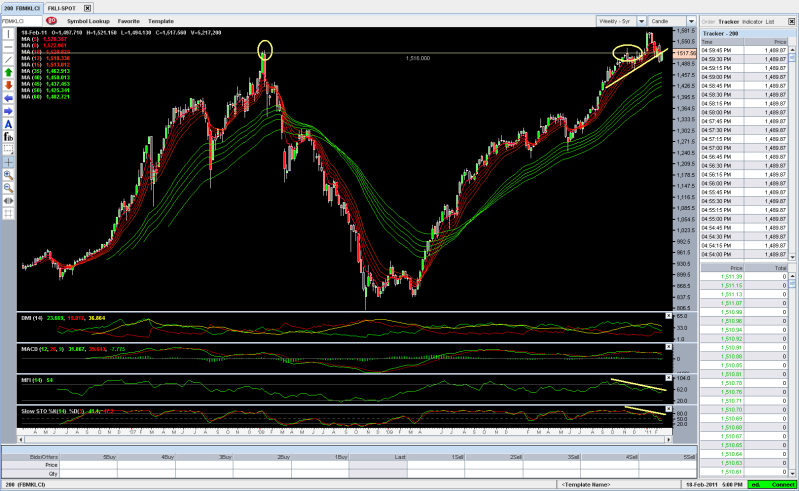
KLCI Long Term Technical Chart, weekly and monthly..
|
|
 Feb 24 2011, 10:10 PM, updated 15y ago Feb 24 2011, 10:10 PM, updated 15y ago
Return to original view | Post
#1
|

Senior Member
1,788 posts Joined: Mar 2009 From: PJ lamansara... :D |
hands were itchy at noon so took a quick look at the 5 yrs weekly and 10 yrs mthly chart... Noticed sign of divergence in the weekly chart and a clear 'double top' in both the weekly n monthly chart... Sifus, any comments?.. I made a mistake in fact by switching my bonds over to equity few days back...a little regret now but holly i'm hopping it will break this critical boundary soon!
no doubt double top is hit...will CI get pass it or market force will kick it down? quite a clear divergence in the weekly |
|
|
Feb 24 2011, 11:53 PM
Return to original view | Post
#2
|
|
Senior Member
1,788 posts Joined: Mar 2009 From: PJ lamansara... :D |
not my usual practise too to look at long term(such a long one especially) but like i said , hands were itchy lol..
|
| Change to: |  0.0141sec 0.0141sec
 0.56 0.56
 6 queries 6 queries
 GZIP Disabled GZIP Disabled
Time is now: 10th December 2025 - 12:56 AM |
 Quote
Quote