

usdx should be good enough to be bought

5 minutes to go....!
Forex | Version 8, Foreign Exchange Market Discussion
|
|
 Aug 2 2011, 04:55 PM Aug 2 2011, 04:55 PM
|
 
Senior Member
1,567 posts Joined: Nov 2005 From: Ppg, Sbh. |
short mode looking good for eur & gbp...
usdx should be good enough to be bought 5 minutes to go....! |
|
|
|
|
|
Aug 2 2011, 04:59 PM
|

Senior Member
1,227 posts Joined: Sep 2004 |
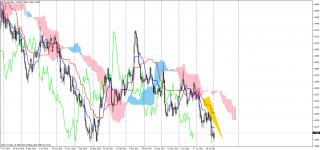
QUOTE(sapapa @ Aug 2 2011, 04:44 PM) Hehe, ichimoku is not bad, but it has pretty slow signals for entry point. Example it is an uptrend, you could have entered at 110.5 instead of 111.5 given by ichimoku. Ichimoku is good, reliable, just that the entry point is slow...hehe I have to agree with you. It is slow because trend traders wait for trend to develop and do not pick the bottom or top as most traders do. I was once such trader and I hit many stop loss because I try to predict where the turning point is. If the turning point is never predicted right, i would have lost 4-5 attempt using fibonacci. This means, for a trend trader, I rather wait for a trend to develop and ride the kumo or kijun as my stop loss. I will try to capture 30-60% of the trend. This will mean that I am trading on the highest probability trading setup. With confidence, I can increase my lot size to profit from this 30-60% trend with ease of mind. I maximize when i get to ride the trend. I cut loss, if i am wrong. Take a look below. These are some of my trend that i am riding. I monitor 25 pairs , daily time frame. No stress. Just managing my stop loss every morning. But again, each individual has its own style. Look for that style that suit your life style.  I have long term and short term strategy. Long term is like a bonus. Short term is like my full time job salary. Attached thumbnail(s) 


|
|
|
Aug 2 2011, 05:07 PM
|
|
Junior Member
264 posts Joined: Feb 2011 |
QUOTE(Quinn @ Aug 2 2011, 04:59 PM) I have to agree with you. It is slow because trend traders wait for trend to develop and do not pick the bottom or top as most traders do. I was once such trader and I hit many stop loss because I try to predict where the turning point is. If the turning point is never predicted right, i would have lost 4-5 attempt using fibonacci. This means, for a trend trader, I rather wait for a trend to develop and ride the kumo or kijun as my stop loss. I will try to capture 30-60% of the trend. This will mean that I am trading on the highest probability trading setup. With confidence, I can increase my lot size to profit from this 30-60% trend with ease of mind. I maximize when i get to ride the trend. I cut loss, if i am wrong. Wow, 25 pairs is crazy. I just focus on the main 6 its enough...hehe...there is a technical tool that allows you to ride a trend at the fastest reversal point possible, and the stop loss is placed very near which means you don't lose alot but you gain at least a 1:1 to 5:1 ratio...I have tried to check the reversal point for this tool compare to ichimoku and I found out that this tool performs 3 times faster than ichimoku, meaning if an uptrend is found at the bottom at 110.00, I would have entered long at 110.25 instead ichimoku gives me 111.00...combining these 2 tools would give double comfirmation of trend riding and exiting strategies...Take a look below. These are some of my trend that i am riding. I monitor 25 pairs , daily time frame. No stress. Just managing my stop loss every morning. But again, each individual has its own style. Look for that style that suit your life style. I have long term and short term strategy. Long term is like a bonus. Short term is like my full time job salary. |
|
|
Aug 2 2011, 08:28 PM
|

Junior Member
207 posts Joined: Dec 2004 |
anyone traders here willing to teach me the basics?
|
|
|
Aug 2 2011, 09:03 PM
|

Senior Member
1,203 posts Joined: Dec 2007 From: Bumi Kenyalang, Kuala Lumpur |
QUOTE(thomas @ Aug 2 2011, 11:11 AM) yes,i short OIL, profitted 455USD ,market damn f***, very hard to earn Where is your record, please don't remove it. |
|
|
Aug 2 2011, 09:47 PM
|
|
Junior Member
264 posts Joined: Feb 2011 |
QUOTE(bulkbiz @ Aug 2 2011, 09:03 PM) Where is your record, please don't remove it. Maybe he lost it all...  |
|
|
|
|
|
Aug 2 2011, 10:03 PM
|
|
Junior Member
38 posts Joined: Sep 2007 |
hey guys,i just wanted to share some free info here.i've been trading for bout a year now and i have developed my own level with 30 SL and TP.i cant say how i do it,but i can share it for free.so far it have 70% chances of profiting.im not getting my money solely from this but its kinda like my part time job too
 so here's the level i see for today gu long 16205 au long 10805 no need to follow@even look at it if ur not interested.its just i wanted to share.dats all .and sometimes if it doesnt work for what i said,it will work for the opposite.i'll share what i have every single day and u can all judge it from now.tq  |
|
|
Aug 2 2011, 10:04 PM
|
|
Senior Member
1,567 posts Joined: Nov 2005 From: Ppg, Sbh. |
the vote for the debt ceiling later on....
wonder what will happen.... |
|
|
Aug 2 2011, 10:59 PM
|
|
Senior Member
1,227 posts Joined: Sep 2004 |
Have you been buying CHF when there is a retracement? You would be laughing to the bank, teeheehee..
|
|
|
Aug 2 2011, 11:42 PM
|

Senior Member
1,238 posts Joined: Nov 2004 From: Penang |
Its going to be heart beat for the overnight trade.
|
|
|
Aug 3 2011, 08:24 AM
|

Senior Member
2,516 posts Joined: Feb 2007 From: Uarla Umpur |
http://www.telegraph.co.uk/finance/financi...-and-Spain.html
QUOTE Europe's money markets freeze as crisis escalates in Italy and Spain any insights.. on this matter.. seems like US is out at the moment while euro growing back into the shit storm....The European money markets have begun to seize up as pressure mounts on the Italian and Spanish banking systems, tracking the pattern seen during the build-up towards the financial crisis in 2008. |
|
|
Aug 3 2011, 09:03 AM
|

Junior Member
126 posts Joined: Jul 2011 |
QUOTE(spcx @ Aug 2 2011, 08:28 PM) anyone traders here willing to teach me the basics? http://www.babypips.com/ |
|
|
Aug 3 2011, 09:24 AM
|
|
Senior Member
1,567 posts Joined: Nov 2005 From: Ppg, Sbh. |
QUOTE(JinXXX @ Aug 3 2011, 08:24 AM) http://www.telegraph.co.uk/finance/financi...-and-Spain.html that is a good new any insights.. on this matter.. seems like US is out at the moment while euro growing back into the shit storm....  short on eur & gbp.... long on usd... hopefully NFP will give some good news... |
|
|
|
|
|
Aug 3 2011, 09:47 AM
|
|
Senior Member
2,516 posts Joined: Feb 2007 From: Uarla Umpur |
http://www.cnbc.com/id/43982984
QUOTE Japan Primes Markets for Yen Intervention, Monetary Easing @poks , any idea how will the euro shitstorm round 2, will effect CHF ?Japan primed financial markets on Tuesday for currency intervention after the yen tested record highs overnight, signalling it may try to tame the unit with a combination of yen-selling and monetary easing. Even as the yen pulled back from Monday's heights, Japanese officials adopted a new, more direct tone, suggesting they were increasingly convinced markets needed a nudge to keep the yen at levels the economy could live with. so far from what i can see "safe-haven" is either AUD... CHF... and JPY... This post has been edited by JinXXX: Aug 3 2011, 09:47 AM |
|
|
Aug 3 2011, 10:13 AM
|
|
Senior Member
1,567 posts Joined: Nov 2005 From: Ppg, Sbh. |
@Mr JinXX
ha ! not a market economic expert here.. from what i see the market is not moving as i look at it.... safe-haven??? didn't see that as "SAFE" anymore... from my POV.. xxxUSD down, USDxxx up.... but seems like now.. xxxUSD down, USDxxx up... (should be the debt thingie) one thing for sure... gold keep on climbing.. should have kept my long.. euro hurricane? hopefully just around the block.. now scalping only.... This post has been edited by poks: Aug 3 2011, 10:16 AM |
|
|
Aug 3 2011, 11:02 AM
|

Junior Member
307 posts Joined: Jan 2003 From: Tmn Sri Rambai,BM,Penang |
One of the great joys of having invented an analytical technique such as Bollinger Bands is seeing what other people do with it. The following rules covering the use of Bollinger Bands were gleaned from the questions users have asked most often and our experience over 25 years of using the bands. While there are many ways to use Bollinger Bands, these rules should serve as a good beginning point.
1. Bollinger Bands provide a relative definition of high and low. By definition price is high at the upper band and low at the lower band. 2. That relative definition can be used to compare price action and indicator action to arrive at rigorous buy and sell decisions. 3. Appropriate indicators can be derived from momentum, volume, sentiment, open interest, inter-market data, etc. 4. If more than one indicator is used the indicators should not be directly related to one another. For example, a momentum indicator might complement a volume indicator successfully, but two momentum indicators aren't better than one. 5. Bollinger Bands can be used in pattern recognition to define/clarify pure price patterns such as "M" tops and "W" bottoms, momentum shifts, etc. 6. Tags of the bands are just that, tags not signals. A tag of the upper Bollinger Band is NOT in-and-of-itself a sell signal. A tag of the lower Bollinger Band is NOT in-and-of-itself a buy signal. 7. In trending markets price can, and does, walk up the upper Bollinger Band and down the lower Bollinger Band. 8. Closes outside the Bollinger Bands are initially continuation signals, not reversal signals. (This has been the basis for many successful volatility breakout systems.) 9. The default parameters of 20 periods for the moving average and standard deviation calculations, and two standard deviations for the width of the bands are just that, defaults. The actual parameters needed for any given market/task may be different. 10. The average deployed as the middle Bollinger Band should not be the best one for crossovers. Rather, it should be descriptive of the intermediate-term trend. 11. For consistent price containment: If the average is lengthened the number of standard deviations needs to be increased; from 2 at 20 periods, to 2.1 at 50 periods. Likewise, if the average is shortened the number of standard deviations should be reduced; from 2 at 20 periods, to 1.9 at 10 periods. 12. Traditional Bollinger Bands are based upon a simple moving average. This is because a simple average is used in the standard deviation calculation and we wish to be logically consistent. 13. Exponential Bollinger Bands eliminate sudden changes in the width of the bands caused by large price changes exiting the back of the calculation window. Exponential averages must be used for BOTH the middle band and in the calculation of standard deviation. 14. Make no statistical assumptions based on the use of the standard deviation calculation in the construction of the bands. The distribution of security prices is non-normal and the typical sample size in most deployments of Bollinger Bands is too small for statistical significance. (In practice we typically find 90%, not 95%, of the data inside Bollinger Bands with the default parameters) 15. %b tells us where we are in relation to the Bollinger Bands. The position within the bands is calculated using an adaptation of the formula for Stochastics 16. %b has many uses; among the more important are identification of divergences, pattern recognition and the coding of trading systems using Bollinger Bands. 17. Indicators can be normalized with %b, eliminating fixed thresholds in the process. To do this plot 50-period or longer Bollinger Bands on an indicator and then calculate %b of the indicator. 18. BandWidth tells us how wide the Bollinger Bands are. The raw width is normalized using the middle band. Using the default parameters BandWidth is four times the coefficient of variation. 19. BandWidth has many uses. Its most popular use is to indentify "The Squeeze", but is also useful in identifying trend changes... 20. Bollinger Bands can be used on most financial time series, including equities, indices, foreign exchange, commodities, futures, options and bonds. 21. Bollinger Bands can be used on bars of any length, 5 minutes, one hour, daily, weekly, etc. The key is that the bars must contain enough activity to give a robust picture of the price-formation mechanism at work. 22. Bollinger Bands do not provide continuous advice; rather they help indentify setups where the odds may be in your favor. Copied from John Bollinger Added on August 3, 2011, 2:27 pmestimating gold to be raise till 1669 -1670 per oz. Approx 800pips  Happy Trading ! This post has been edited by thomas: Aug 3 2011, 02:27 PM |
|
|
Aug 3 2011, 02:30 PM
|

Junior Member
55 posts Joined: Aug 2010 |
Any idea when gold will retrace? Already rise more than 15% right? The up trend.
|
|
|
Aug 3 2011, 02:34 PM
|
|
Junior Member
307 posts Joined: Jan 2003 From: Tmn Sri Rambai,BM,Penang |
QUOTE(NinjaAss@ssin @ Aug 3 2011, 02:30 PM) Any idea when gold will retrace? Already rise more than 15% right? The up trend. after around 1669-1670 , 5 to 7 hours to go.Added on August 3, 2011, 2:41 pm1664 already !!!! Added on August 3, 2011, 2:42 pmGuys, see my b.band telling you all correct result or not.. 1665 !!! Added on August 3, 2011, 2:44 pm1666 !!!! HUAT AH !!! Added on August 3, 2011, 2:45 pm1667 !!! ARRR !!!! This post has been edited by thomas: Aug 3 2011, 02:45 PM |
|
|
Aug 3 2011, 02:46 PM
|
|
Senior Member
1,238 posts Joined: Nov 2004 From: Penang |
always follow the trend aye Mr Thomas
|
|
|
Aug 3 2011, 02:48 PM
|
|
Junior Member
307 posts Joined: Jan 2003 From: Tmn Sri Rambai,BM,Penang |
QUOTE(Hunz @ Aug 3 2011, 02:46 PM) always follow the trend aye Mr Thomas Not really, if you see my previous trade, 70% of my trade are anti trend and I profitted.Added on August 3, 2011, 2:50 pm1668~ !! Added on August 3, 2011, 2:50 pm1669 !!! This post has been edited by thomas: Aug 3 2011, 02:50 PM |
|
Topic ClosedOptions
|
| Change to: |  0.0222sec 0.0222sec
 0.74 0.74
 6 queries 6 queries
 GZIP Disabled GZIP Disabled
Time is now: 4th December 2025 - 02:10 AM |
 Quote
Quote